Autotrophs and Heterotrophss
Here is a picture of Todd and his pet flower, Rex.

Todd and Rex are biotic factors, but they get the energy they need to survive differently. Rex is a plant, and plants, algae, and certain bacteria are autotrophs. Autotrophs, or producers, can make their food. Rex and other plants, algae, and bacteria can convert the energy in light into food via photosynthesis.
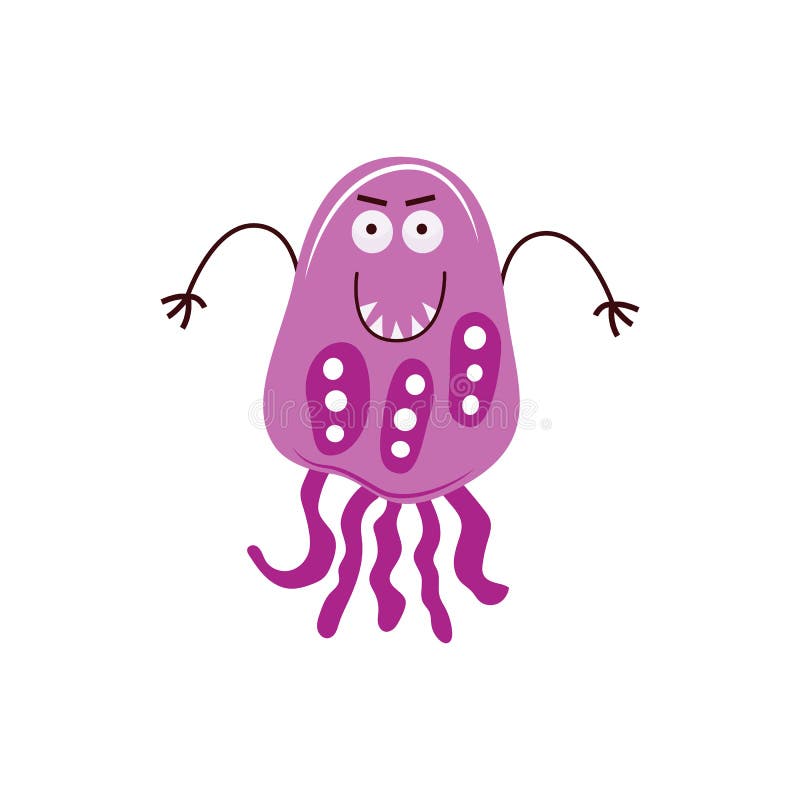
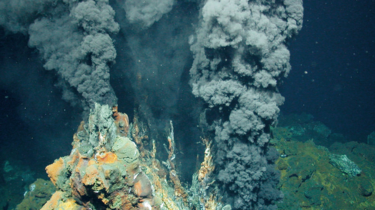
Frank is an autotrophic bacterium that lives thousands of meters below the ocean’s surface, with no light. Frank lives on hydrothermal vents that spew out hot, hydrosulfide gas that is toxic to most life forms. However, Frank uses the energy in the gas to make food via chemosynthesis.
Autotrophs are at the bottom of the food chain because they are the food source for all organisms that get their energy from eating organic matter. Todd is a heterotroph, or consumer, because he needs to eat animals to get the energy he needs to survive. Animals, fungi, and most bacteria are examples of heterotrophs.

The classification of heterotrophs is determined by what they eat.
- Herbivores eat autotrophs (plants and algae).
- Carnivores eat animals.
- Omnivores eat plants, algae, and animals.
- Decomposers eat dead organisms (autotrophs and heterotrophs).


Food Chains and Trophic Levels
Food Chains
A food chain shows the energy flow through an ecosystem from the producer to the top predator (apex consumer). Below is an example of a simple food chain.

The arrows in the food chain represent the energy flow through an ecosystem. The arrows point in one direction because this is how energy moves through ecosystems. For example, when the herbivore eats the grass, it gains the grass’s energy. The energy is now in the herbivore and will never return to the grass. For energy to move in two directions, the herbivore would have to vomit the plant, which would then eat the herbivore – this does not happen.
Trophic Levels
Each step in a food chain represents a trophic level. In a food chain, energy moves from trophic level to trophic level; however, only 10 % of the energy transfers from one trophic level to the next.
Where does the other 90% of energy go?
Well, most of the energy loss happens when an organism digests food. When we digest food, most of the energy in the food converts to heat or is used by an organism or lost as waste (poop). On average, 10% of the energy in food becomes part of the organism’s biomass.
What is biomass?
Biomass is the amount of stored matter in an organism that contains energy. When deer eat grass, they only get 10% of the grass’s biomass energy. When a mountain lion eats a deer, they get 10% of the deer’s biomass energy but only 1% of the grass’s biomass energy.
What?!?!?
Okay, let’s do some math.
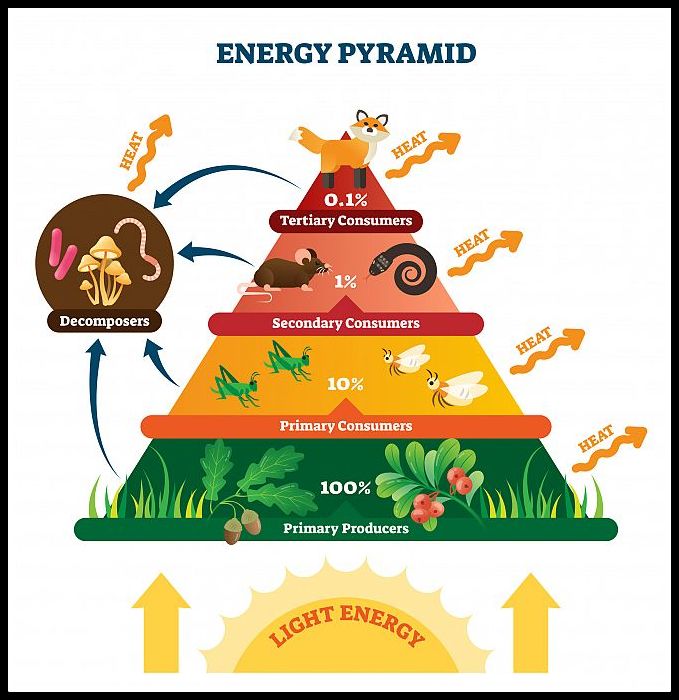
- Trophic Level 1: Autotrophs, such as grass, contain 100% of the energy captured from the sun.
- Trophic level 2: When a herbivore or omnivore eats the grass, only 10% of its energy becomes part of its biomass. Therefore, only 10% of the original biomass is available to the carnivores and omnivores in the third trophic level.
- Trophic Level 3: When a carnivore eats the herbivore or omnivore in the second trophic level, only 10% of the second-level organism’s energy becomes part of its biomass. Well, 10% of 10% is 1%. Therefore, organisms in the third trophic level only get 1% of the first trophic level’s available energy.
- Trophic Level 4: Carnivores and omnivores that eat organisms in the third trophic level receive only 0.1 % of the producers’ available energy (first trophic level).

The loss of energy from one trophic level to the next is why the first trophic level always contains the most biomass/energy. The last trophic level (4th, 5th, or 6th) has the least biomass or energy. Therefore, in healthy ecosystems, the most biomass is in the producers, and the least amount of biomass is in the apex predators.
The 10% Rule
The 10% rule is the average energy transfer between trophic levels. Some organisms have more available energy and others have less. To figure out how much biomass energy is available in an organism, we need to do some math.
A kilocalorie is a unit of energy, but we commonly call it a Calorie (yes, with a capital C). If the meal you eat contains 820 Calories, then it also has 820 kilocalories. Therefore, Calories and kilocalories (kcal) are the same.
Todd, a level 14 dragon, is a carnivore and an apex predator. Todd’s favorite meal is unicorns who have lost their magic. Todd thinks magic tastes bad. The average nonmagical unicorn eats 2000 kcals per day. However, unicorns cannot digest all of the grass biomass, so they excrete (poop) 500 kcals of biomass. The unicorns use 1250 kcals for metabolism (cellular process and heat loss). How much biomass is available in a unicorn for Todd?
Formula: Total energy in food – the energy excreted – the energy used for metabolism = the energy available to organisms in the next trophic level
2000 kcals – 500 kcals – 1250 kcals = 250 kcals
Now we need to find the percentage of biomass in the unicorn that is available to Todd.
Formula: (energy available / total amount of energy) x 100% = percentage of energy available
(250 kcals / 2000 kcals) x 100% = 12.5%
Therefore, 12.5% of the unicorn’s biomass is available to Todd.
Food Webs
Ecosystems comprise many intertwined food chains that form a food web. Food webs form many arrows showing the flow of energy – e.g., the food web of a marine ecosystem below.

However, you will be responsible for understanding the flow of energy and biomass through a simplified food web.
The arrows in the food web above represent energy movement from one trophic level to the next. The arrows always point towards the organism in the next trophic level (the predator) because energy flows in one direction through an ecosystem.
Use the food web below to help you answer the questions in the practice quiz below.

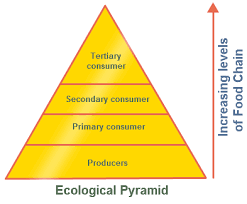
Ecological Pyramids
Ecological pyramids show the amount of energy, mass, and number of organisms in each trophic level.
- The bottom of the pyramid (first trophic level) always contains the producers (plants).
- The second trophic level contains the primary consumers, which eat plants (herbivores or omnivores).
- The third trophic level contains the secondary consumers (carnivores and omnivores) that eat the primary consumers.
- The fourth trophic level contains the tertiary consumers (apex carnivores and omnivores) that eat secondary consumers.
Pyramid of Energy
The pyramid of energy shows the total amount of energy available at each trophic level. The most energy is always in the first trophic level (base of the pyramid), and the least amount of energy is always in the last trophic level (top of the pyramid).

Pyramid of Biomass
The pyramid of biomass shows the total amount of biomass available at each trophic level. The most biomass is always in the first trophic level (base of the pyramid), and the least amount of biomass is always in the last trophic level (top of the pyramid).

Pyramid of Numbers
The pyramid of numbers shows the number of organisms at each trophic level. There are two types of a pyramid of numbers.
- Grassland-The first is a pyramid where the number of organisms and the amount of mass/energy is greatest in the first trophic levels. These pyramids usually represent grasslands, where it takes many plants to comprise all of the biomass.
- Forest-The second pyramid is more of a diamond than a pyramid because the first trophic level contains the most mass/energy, but it has fewer organisms than the second and possibly the third trophic level. How is this possible? Well, trees are massive organisms with a lot of biomass. One large tree will have the biomass of hundreds or thousands of small plants (grass). Therefore, one large tree can support many primary consumers and secondary consumers.


Where do the Decomposers Go?
Decomposers eat all things that die, so they obtain energy from all of the trophic levels. Therefore, decomposers are in their special trophic level and not within an ecology pyramid.