What is a Population?
A population is a group (2 or more) of the same species (organism) in a given area. For example, yesterday, I saw a flock of turkeys in the easement behind my house. There were six turkeys, which is the population density in my easement.
Population density refers to how many members there are in a population. Population density varies based on the area, or range, surveyed. For example, the human population in Benicia is about 30,000, 38 million in California, 330 million in the United States, and 7.8 billion in the world.
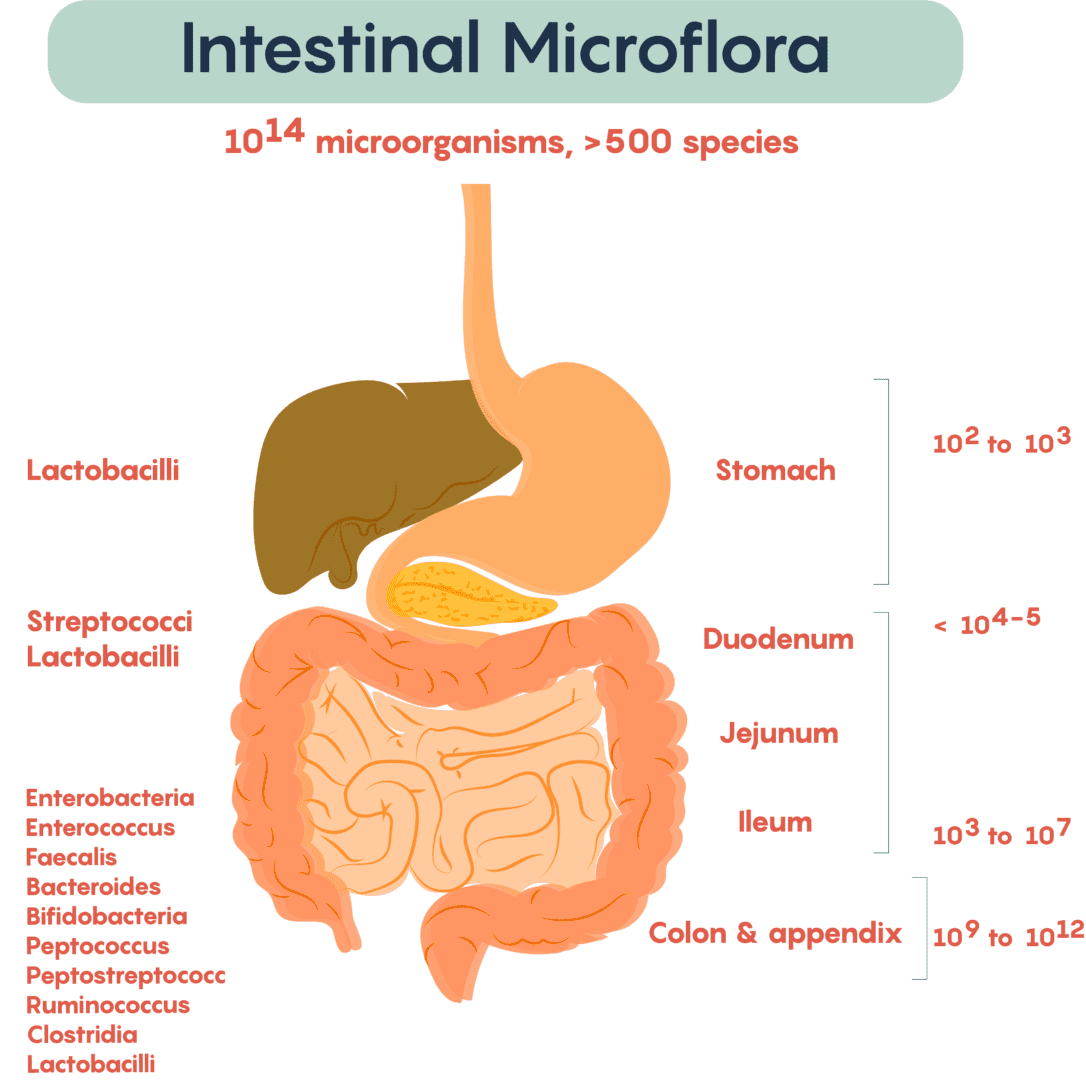
And ranges can be super small. Your intestines are home to a community of bacteria that have a combined population of 100 trillion cells – that’s twice as many bacteria as cells in your body.
The Population Density is Constantly Changing
The population density of a given area is in flux due to the following:
- The number of deaths
- The number of births
- The number of organisms that immigrate[ref]Organisms immigrate into a population, leading to a increase in population density[/ref] (enter) into a population
- The number of organisms that emigrate[ref]Oramism emigrate out of a populaltion, leading to a decrease in population density[/ref] (leave) a population
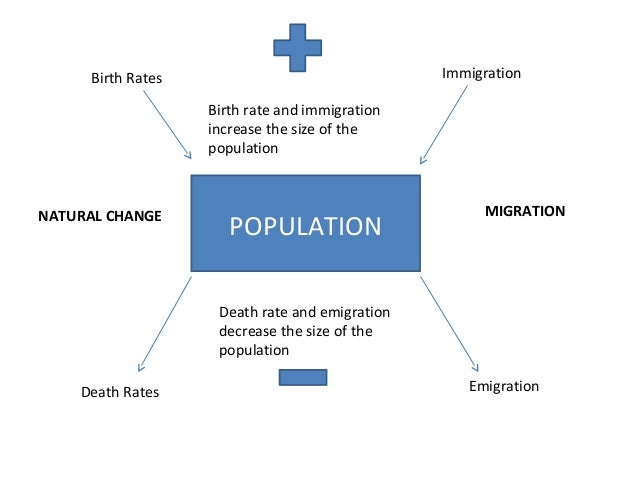
The human population is growing in number because the birth rate is faster than the death rate. For example, there are 7,841,678,364 people on Earth as of writing this sentence. Now, there are 7,841,678,932 people as of writing this sentence. By the time you read this, tens of thousands of humans were added to the world’s population from the point in time I wrote this paragraph.
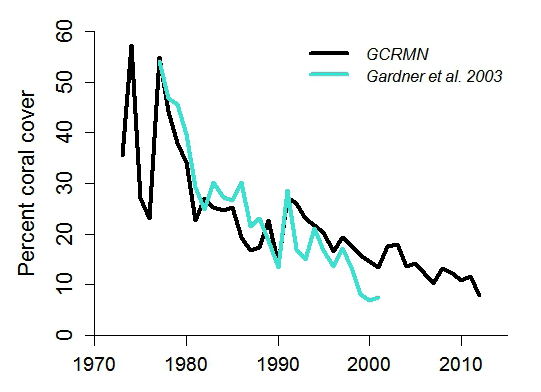
Corals are animals, not plants. However, coral can only grow where light is present because the symbiotic algae that grow on them undergo photosynthesis, which feeds the coral. The population of corals has decreased dramatically over the past decades because their death rate exceeds their birth rate.
In the summer, the monarch butterfly population in Washington and the Sierra Nevada mountain range is larger than the population during the winter. Monarchs are migratory animals and move with the seasons. During the warm spring and summer months, the monarchs immigrate (enter) into the state of Washington and the Sierra Nevada mountains and emigrate (leave) from the California coast, and vice versa during the fall and winter months.

Calculating Population Size
Now, let’s get back to turkeys. You want to know how many turkeys there are in a 5 square kilometer area between Benicia and Cordellia. So, how many turkeys did you count?
What? I was supposed to count turkeys?
Kids these days. When I was your age turkey counting was all the rage. I stayed awake for three days to count turkeys. Ah, the 1990s were the best.
I am at a loss for words.
We’ll luckily I sent my 10-year-old daughter out to do the survey.
You let your 10-year-old daughter roam the Benicia hills?
Yep. Got to keep the tradition alive. Anyways, my daughter counted 35 turkeys or N=35. However, I want to know how many turkeys there are per square kilometer (km). Let’s do the math.
Formula:
Population\:Density = \frac{population\:size}{area\:(km^2)}Example Problem:
\frac{35\:turkeys}{5\:km^2} = 7\:turkeys/km^2Therefore, there are about seven turkeys per square kilometer.
Counting large animals like turkeys and deer is time-consuming but doable in small ecosystems. However, when observing small organisms or large organisms in an ecosystem that spans hundreds or thousands of square km, it isn’t practical to count all the population members. For example, the Benicia State Park’s area is too large (~100 square miles) to count every field rat or any other small animal or plant. So instead of counting all of the rats, scientists use math to estimate the population number.

Assume you are a biologist.
No.
Please play along.
Fine.
You, a biologist, want to know the population of field mice at Benicia State Park. You set 100 non-lethal rat traps across the state park. A week later you find that 67 traps contain rats. You mark the rats and then release them back into the wild and rebait the rat traps. Another week passes, and discover that 86 traps have rats in them. Twenty-seven (27) of the rats have a marking (rats captured the first time), and 59 have no marking (newly caught rats).
Now wouldn’t it be awesome if there was a math formula to estimate the rat population at the state park?
No.

Yes?
Awesome. Now, prepare to have your mind blown because the awesome fairy has brought a whole cup of awesome math and is ready to disperse the awesome power of its mathematical awesomeness.
Here is the Mark and Recapture Formula:
Population\:density\:(N) = \frac{(initially\:marked\:[M]\:\times\:total\:animals\:in\:second\:sample\:[T])}{number\:of\:recaptured\:animals\:[R])}or
N = \frac{(M\:\times\:T)}{R}
Let’s calculate the estimate of the number of rats at the state park using the formula above.
N = \frac{(67\:\times\:86)}{27}N = \frac{5,762}{27}N=213
Therefore, there are an estimated 213 rats at the state park. I told you the math is awesome.

Dispersal Patterns
You discovered that most of the rats caught were near bodies of water. Being the scientist that you are, you decide to do another experiment. You place 50 traps near the water and 50 traps on dry land a kilometer from the water. A week later, all the traps by the water contained a rat, while 14 traps on dry land had rats. Why?
There is more food by the water.
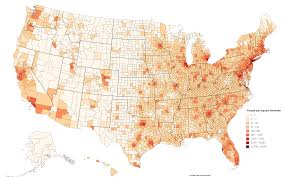
Correct. Populations tend to fall into one of three types of dispersal patterns. The rats you are studying form a clumped dispersion pattern because they primarily congregate near the water.
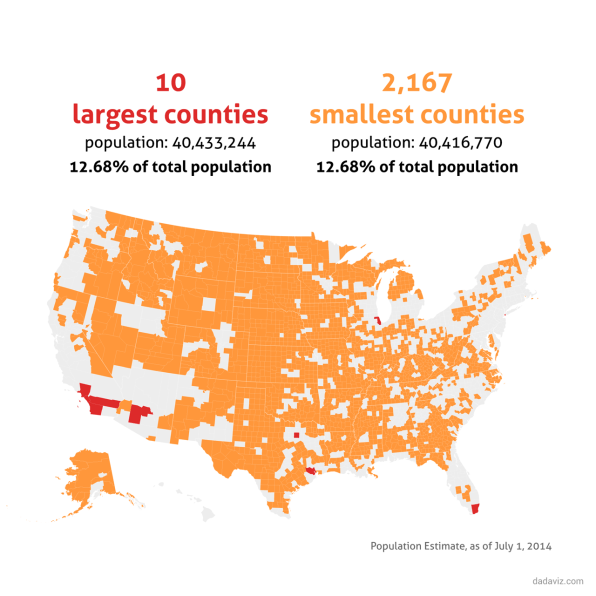
Humans are part of a clumped pattern as well. Below is a population density map of the United States. Most of the American population (and humans in general) live in cities and metropolitan areas, and fewer humans live in rural areas.

Uniform dispersion develops when organisms within a species must compete for limited resources, which creates territories of the same size. Emperor penguins display uniform dispersion when nesting. Since the amount of bare rock in Antarctica is limited, penguin nesting grounds are highly territorial, which leads to a uniform pattern.

In most situations, seeds are randomly spread via wind or water. Some of the places that the seeds immigrate to are fertile ground, and other locations are not. The nonuniformed dispersal and sprouting of seeds lead to a random pattern called random dispersion.

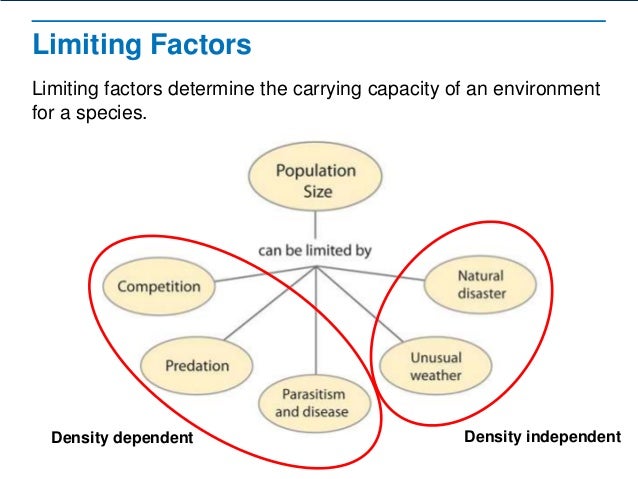
Limiting Factors
The number of resources available to a population will determine its growth rate. Resources are the things a population needs to survive – e.g., water, food, oxygen, and space. A population with an abundance of resources will multiply, and a population that does not have enough resources will either stop growing or decline in number.
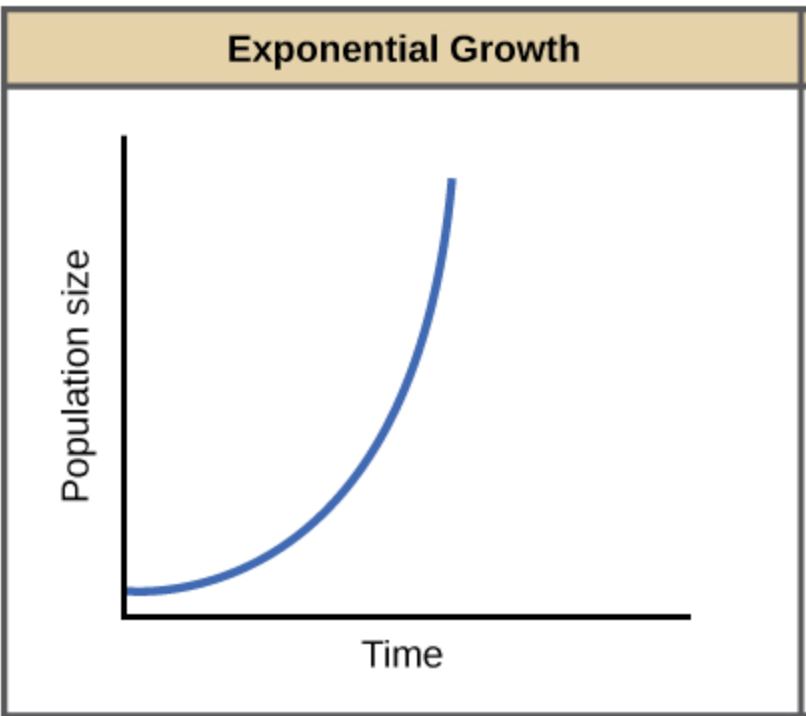
Exponential Growth
A limiting factor is a resource that affects the growth of a population. A population with a lot of resources will experience exponential growth, which forms a J-shaped curve when graphed. Exponential growth is fast, but it will not last forever, because there is always a limited number of resources.

Logistic Growth
Populations that stop growing have reached their carrying capacity. Carrying capacity is the maximum number of individuals in a population that an environment can support due to limited resources. Carrying capacity generally occurs after exponential growth, which forms an S-shaped curve when graphed (this is logistic growth). A healthy, established population will hover around its carrying capacity for generations (assuming the number of resources remains the same).

Types of Limiting Factors
All environments are in flux; therefore, population densities change with time. The two primary limiting factors that affect population size are density-dependent limiting factors and density-independent limiting factors.
Density-Dependent Limiting Factors
A density-dependent limiting factor is dependent on the density of a population. COVID-19 and other contagious diseases are examples of density-dependent limiting factors because contagions can only spread when organisms are close to each other. For example, the reason why you did not attend school last year is that the coronavirus (SARS-CoV-2) is super contagious and quickly spreads when people are in close contact with one another – such as cramming 30-40 people into a classroom. If the population density decreases via death, immunity, or social distancing, then the spread of the pathogen will slow.
COVID-19 Spreading Without Social Distancing (Dense Population)
COVID-19 Spreading With Social Distancing (Less Dense Population)
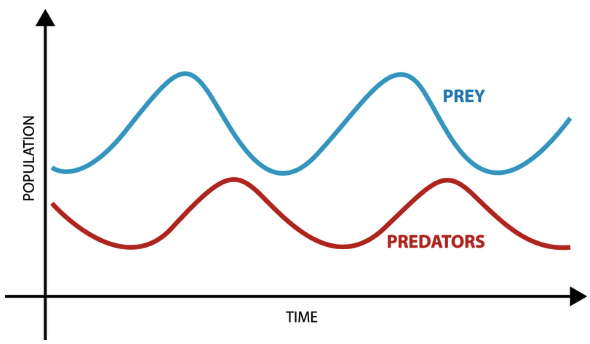
Predation is another example of a density-dependent limiting factor. The graph below is an example of how the population density of the prey affects the population density of the predators and vice versa. With an increase in the number of prairie dogs (predator), the amount of grass decreased (prey). The increase in prairie dogs (prey), led to a rise in ferrets (predator). And the increase in ferrets (prey), led to the rise in foxes (predator). Graphing the predator-prey cycle makes analysis of this density-dependent factor easy to recognize.

Density-Independent Limiting Factors
Imagine there is a large deer population (N=83) on one side of a volcano and a smaller population (N=8) on the other side of the volcano. The volcano erupts, and all members of both populations perish. The volcanic eruption is a density-independent limiting factor because the size of the population does not matter. If a population is at the wrong place at the wrong time during a natural disaster or extreme weather, small and large populations will be affected by these profound events.
So would Thanos’ snap at the end of Infinity War is a density-independent limiting factor?
Yes, it is. His snap killed life throughout the entire universe, in densely populated and sparsely populated areas.