The Vitals
Most medical appointments begin with measuring a patient’s vital signs. The most common measurements are as follows:
- Body temperature measures whether a patient is hyperthermic or hypothermic.
- Pulse rate measures heart rhythm and pulse strength.
- Oxygen saturation measures the amount of oxygen bound to hemoglobin.
- Respiration rate measures the number of breaths per minute.
- Height and weight measures body mass index (BMI).
- Blood pressure measures the force of blood against the walls of the arteries.
This chapter focuses on blood pressure. Abnormal blood pressure can have drastic, systemic effects. For example, if a patient has high blood pressure (hypertension) then they are at risk of:
- Vision loss
- Stroke
- Problems with the heart – i.e., arrhythmias (irregular heartbeat), angina (severe pain in the chest), myocardial infarction (heart attack), cardiac arrest (stoppage of the heart)
- Kidney disease and possible kidney failure
- Sexual dysfunction, such as impotence
- Migraines
- Labored breathing
- Fatigue
Diagnosis of hypertension occurs when a patient has multiple high readings over numerous visits. If a patient has high blood pressure during a doctor’s appointment but normal blood pressure on the next visit and the visit after that, the high measurement is probably an anomaly. Many variables can lead to a single high blood pressure reading, such as dehydration, exercise (the patient was late and ran to the doctor’s office), and stress. However, there are always exceptions to the rule. If a patient has extremely high blood pressure, they may be at immediate risk of myocardial infarction and stroke.
What is Blood Pressure?
Blood pressure is the measurement of the force the blood exerts on the walls of the blood vessels. Even though blood pressure exists in all blood vessels, it is the greatest and easiest to measure arterial blood pressure. The heart’s ventricles pump blood directly into the arteries; therefore, blood pressure is highest in the arteries. As the blood moves away from the heart, blood pressure decreases and becomes almost nonexistent when blood enters the vena cava veins.
Blood pressure is the highest in the arteries, but the arterioles control the blood pressure in the capillaries. Surrounding arterioles are patches of smooth muscle that help maintain near-constant blood pressure in the capillaries. If the capillaries’ blood pressure is too high, the arterioles will decrease the diameter of their lumen via vasoconstriction. If the capillaries’ blood pressure is too low, the arterioles will increase the diameter of their lumen via vasodilation. However, abnormally low or high blood pressure may make it difficult for the arterioles to regulate capillary blood pressure. Abnormal measurements usually require medical treatment.
Measuring Blood Pressure
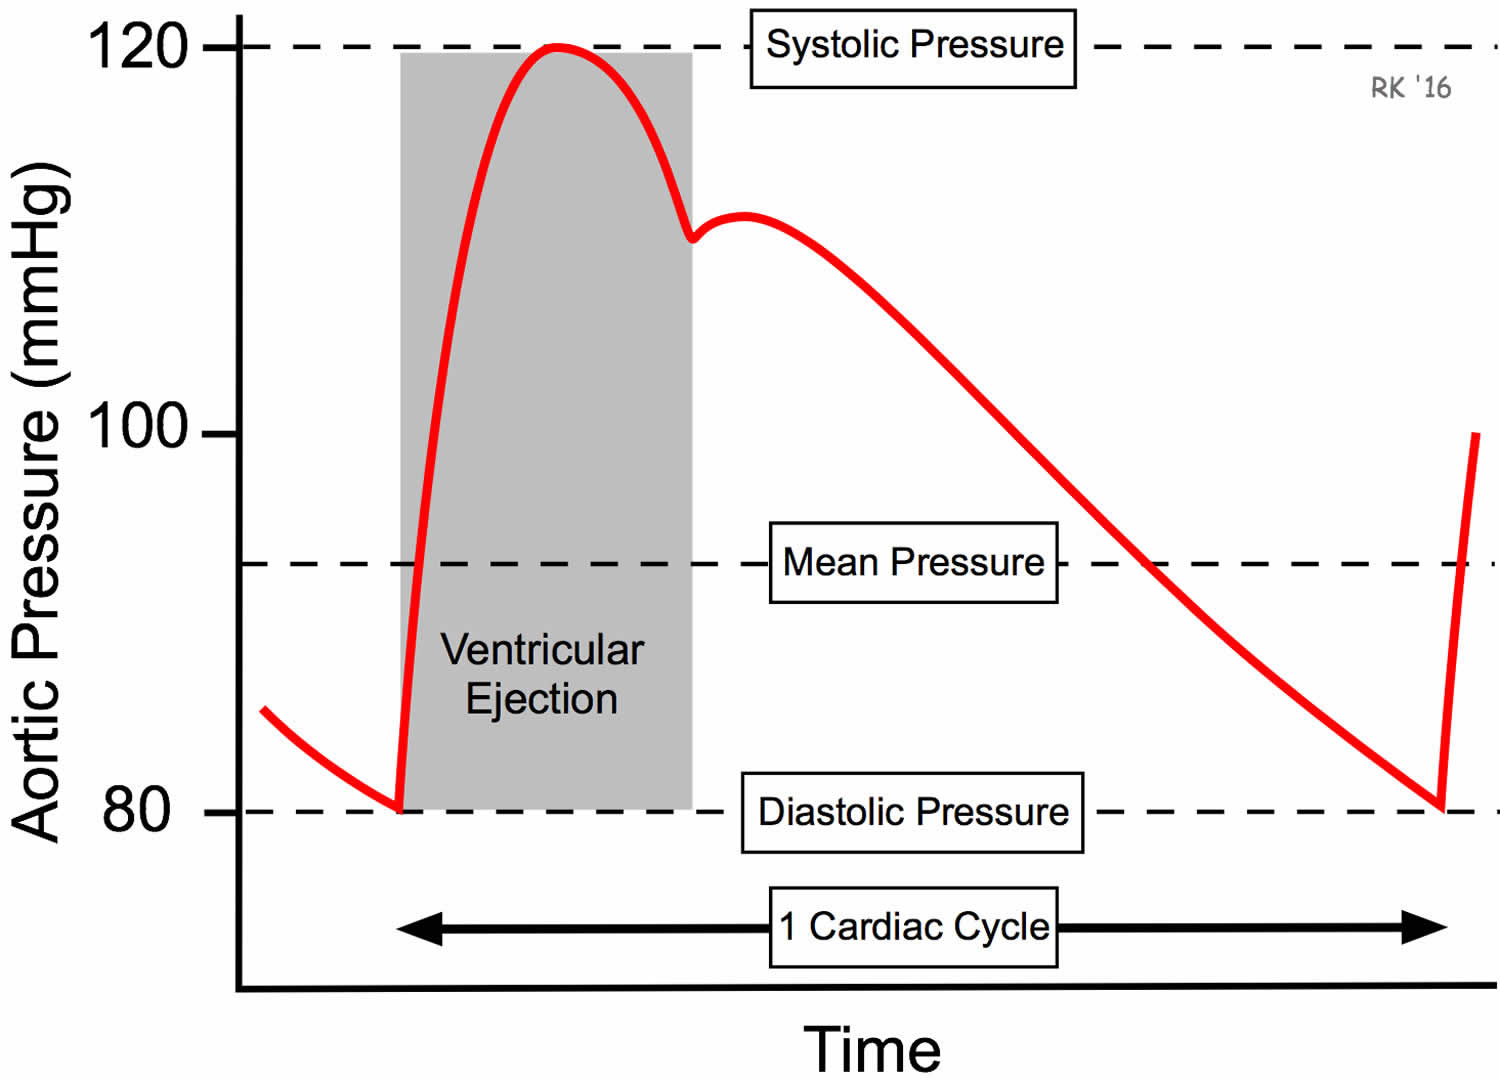
When the ventricles contract (systole), blood ejects into the arteries. The influx of blood increases the pressure on the arterial walls to a maximum pressure called systolic blood pressure. When the ventricles relax (diastole), the arterial walls’ pressure drops to a minimum pressure called diastolic blood pressure.

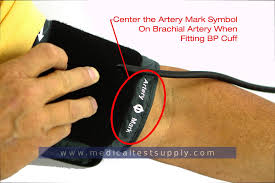
Any major artery within the limbs can measure blood pressure, but the brachial artery is often used because it is lateral to the heart. The brachial artery runs along the center of the arm, deep to the biceps brachii. A sphygmomanometer, or blood pressure cusp, measures blood pressure and can be automated or manual. Automated sphygmomanometers are easier to use, but a trained clinician can get a more accurate reading with a manual blood pressure cuff.
| This is the Correct Way to Measure Blood Pressure | This is the Wrong Way to Measure Blood Pressure |
|---|---|
 |  |
Here are the steps on how to use a manual sphygmomanometer:
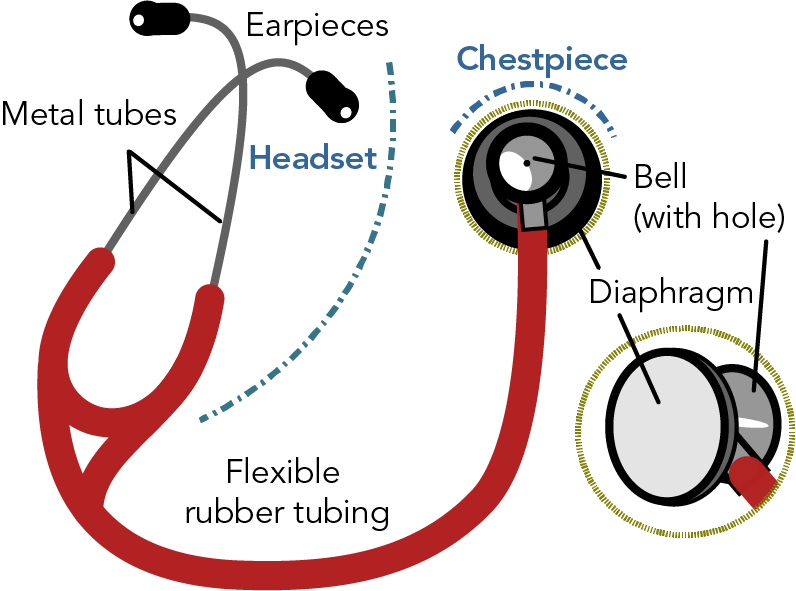
1. Wash your hands and clean the stethoscope’s diaphragm with a disinfectant.
2. If possible, have the patient sit upright with their arm resting in their lap, on an armrest, or something else that keeps their arm at heart level.
3. Place the blood pressure cuff over the brachial artery, with the distal portion about a centimeter from the bend in the elbow.

4. Ensure the artery mark on the cuff points directly above the midline of the bend in the elbow.
5. Place the stethoscope’s diaphragm over the bend in the elbow and tuck it under the distal portion of the blood pressure cuff.

6. Find the radial pulse.
7. Watch the needle on the aneroid manometer gauge for the next steps. The distance between two graduation marks has a value of 2 mmHg.
8. Inflate the cuff until you can no longer feel the pulse, and then increase the cuff’s pressure by 20 mmHg. You have now cut off the flow of blood in the brachial artery.
9. Turn the bulb valve a quarter turn so that the air leaks out at 2 mmHg per second (or one graduation mark per second).
10. Listen for the first Korotkoff sound that makes a tapping noise. The first Korotkoff sound measures systolic blood pressure. Record the pressure on the gauge – e.g., if the needle is pointing at the 120 mmHG graduation mark, this is the patient’s systolic blood pressure.

11. The Korotkoff sounds will weaken as the cuff’s pressure decreases.
12. The last Korotkoff sound you hear measures the diastolic blood pressure. Record the number on the gauge – e.g., if the needle is pointing at 74 mmHg, this is the patient’s diastolic BP.
13. Completely open the ball valve to release all the air out of the cuff.
14. Remove the cuff from the patient’s arm.
15. Wash your hands and sanitize the stethoscope’s diaphragm.
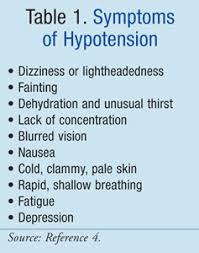
The patient’s blood pressure measured in the procedure above is 120/80 mmHg. Average healthy blood pressure ranges from 90/60 mmHg to 120/80 mmHg, but the healthy range varies between individuals. For example, a previous student measured her resting blood pressure at 52/38 mmHg with an automated sphygmomanometer. This measurement came from an automotive wrist sphygmomanometer, which can be inaccurate. I told her to retake her blood pressure, and 52/38 mmHg was again illuminated on the screen. I then used a manual sphygmomanometer to measure her blood pressure. After three measurements, all readings were about 52/38 mmHg. According to medical blood pressure scales, my student would have had dangerously low blood pressure or severe hypotension. However, she had none of the symptoms of hypotension. She was alert, with no feelings of lightheadedness, dizziness, or nausea. Her vision was fine; she did not have rapid, shallow breathing and a weak and rapid pulse. Since I am not a medical doctor, I told her she might want to get a doctor’s opinion. She did, and the doctor informed her that 52/38 mmHg was her healthy resting blood pressure. It turns out that she has very elastic arteries that reduce the pressure exerted on their walls. Therefore, a blood pressure reading of 52/38 mmHg, which usually indicates severe hypotension that requires immediate medical attention, was equivalent to a 110/70 mmHg reading in most healthy adults.


However, abnormally high or low blood pressures usually indicate pathology, and sometimes, a patient will have little to no symptoms of abnormal blood pressure. For instance, a family member recently was at a CVS pharmacy and decided to take his blood pressure while waiting for his prescription. The machine measured his blood pressure at 205/115 mmHg. He measured his blood pressure again, and he got the same results. He asked the pharmacist how accurate the machine was, and the pharmacist said it was accurate. He showed no severe hypertension symptoms – i.e., shortness of breath, severe headache, blurred vision, and chest pain. The pharmacist advised that he go to the emergency room immediately, which he did. The medical staff measured his blood pressure at 205/110 mmHg at the ER. He was diagnosed with severe hypertension and had a good chance of having a myocardial infarction (heart attack) or stroke. Luckily, the doctors easily treated his hypertension, and he was released from the hospital in a matter of hours.
Most people with severe hypertension and hypotension will have symptoms. But no two human physiologies are the same. An abnormal blood pressure for most may be normal for a few, and vice versa.
Mean Arterial Pressure
Blood pressure is in constant flux. Also, the heart spends twice as long in diastole as in systole. Therefore, average blood pressure during a cardiac cycle (one heartbeat or the time from one P wave to the next) can give clinicians a better understanding of blood perfusion within the arteries. The average blood pressure during a single cardiac cycle is the mean arterial pressure (MAP).
The pulse pressure is a reflection of the stroke volume. Calculating the MAP requires knowing the pulse pressure, which is systolic blood pressure minus the diastolic blood pressure. Patient A arrives in the ER with a 116/74 mmHg blood pressure. Calculate his to calculate pulse pressure.
Systolic \:BP \: – \: Diastolic \:BP = Pulse\:Pressure
116 \: mmHG \: - \: 74 \: mmHg = 42 \: mmHg
Now that you know Patient A’s pulse pressure, you can now calculate their MAP using the following formula:
MAP = Diastolic \: BP \: + \: (\frac{pulse \: pressure}{3})MAP = 74\: mmHg \: + \: (\frac{42 \: mmHg}{3}) = 88 \: mmHgThe healthy resting MAP range is between 70 mmHg and 100 mmHg. However, healthy individuals can have a MAP outside of the normal range.
Factors that Affect Mean Arterial Pressure
Blood viscosity, peripheral resistance, and cardiac output are the three primary factors that affect MAP. The volume and consistency of solutes in the blood plasma determine blood viscosity. (Viscosity is a measure of the thickness and stickiness of a liquid.) Low plasma levels or plasma with an elevated level of solutes increase blood viscosity. An increase in blood viscosity will increase the peripheral resistance within the arteries.
Peripheral resistance is the friction between the blood and the walls of the blood vessels. (Technically, blood vessels with large lumens will have lower peripheral resistance, and blood will flow more easily through them than blood vessels with small lumens.)

A decrease in the diameter of arteries is a common symptom of a cardiovascular disease called atherosclerosis. Atherosclerosis is a disease caused by the formation of a thrombus. When a person has high plasma levels of low-density lipoprotein (LDL) cholesterol (“bad” cholesterol), the excess cholesterol will bind to the walls of arteries (and veins), creating plaques. Plaques have rough edges that can trick the body into thinking the artery wall is damaged, triggering the blood clotting process. Platelets adhere to the plaques, increasing the thrombus’s size on the arterial wall. As the thrombus grows, the lumen diameter decreases, increasing the peripheral resistance and thus increasing the MAP. The raised MAP in the arteries leads to an increase in afterload and decreased cardiac output.

When the left ventricle contracts, there is afterload resistance in the systemic blood vessels that the left ventricle needs to overcome to eject blood. The greater the afterload, the more the left ventricle has to increase its effort (contractility and preload) to maintain resting cardiac output. Afterload increases when the diameter of the systemic blood vessels, primarily arterioles, decreases. Increased blood viscosity also increases afterload but to a lesser extent.

Systemic vascular resistance (SVR) is the quantifiable afterload measurement, and vasodilation of the systemic arterioles is the primary regulation of SVR. If the SVR increases and CO remains the same, then MAP increases. If SVR decreases and CO stays the same, then MAP decreases. During exercise, SVR tends to decrease because there is an increase in vasodilation of the systemic arterials. Still, CO increases faster, so there is generally a slight increase in MAP.


Here are a few acronyms and definitions you need to know before we calculate SRV’s effect on CO and MAP.
- SVR = afterload pressure
- MAP = mean arterial pressure
- Central Venous Pressure (CVP) = pressure in the right ventricle during diastole, the same pressure in the vena cava veins.
- CO = cardiac output
- The units for SVR, MAP, and CVP are mmHg (however, dynes/sec/cm5 are the common units for SRV)
- Units for CO is L/min
SRV is analogous to the gravitational force a rocket must exceed to leave Earth’s orbit. The gravitational force is 9.8 m/s2, but a rocket must move faster than this to move beyond Earth. SRV is the minimal force the left ventricle has to achieve to eject blood into the arteries. However, a healthy cardiac output requires a much greater force.
Let’s do some math to clarify what SRV is and how it affects MAP and CO. We’ll use Patient A’s MAP of 88 mmHg. We’ll assume Patient A has a resting CO of 5.4 L/min. The average resting CVP is 2 mmHg.
SVR = \frac{MAP \: - \: CVP}{CO}SVR = \frac{88 \: mmHg \: - \: 2 \: mmHg}{5.4 \: L/min} = 15.9 \: mmHg/L/minThe SVR is 16 mmHg/L/min, which means Patient A’s left ventricle’s contractile force has to be greater than 16 mmHg to begin to eject its blood volume. (Sixteen mmHg is the minimal force required to pump blood out of the left ventricle. However, greater force is needed to create a high stroke volume to maintain CO.)
Now, let’s look at the effect of hypertension on SVR. Assume Patient B has a blood pressure of 186/96 mmHg, which means they have a MAP of 126 mmHg. Their CO is 5.4 L/min, the same as Patient A’s CO.
SVR = \frac{126 \: mmHg \: - \: 2 \: mmHg}{5.4 \: L/min} = 22.9 \: mmHg/L/minPatients A and B have the same resting CO, but Patient B’s SVR is 44% higher. Patient B’s left ventricle must overcome a greater afterload to pump the same blood volume per minute as Patient A. This extra work is not sustainable in the long run and will most likely lead to a lower stroke volume and CO, which increases the risk of stroke, myocardial infarction, and sudden cardiac arrest.