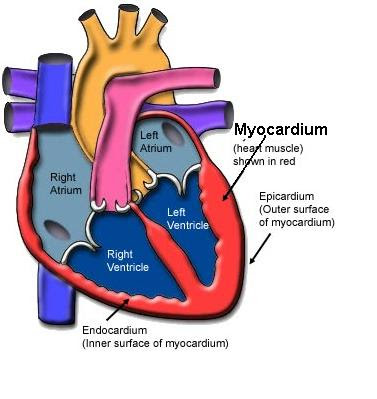
The Myocardium
The walls of the heart’s four chambers have a layer of cardiac muscle called the myocardium. The myocardium in the atria walls is thinner than the myocardium layer in the ventricles’ walls, and the left ventricle has more myocardium than the right ventricle. The heart consists of other tissues, but the myocardium will be the primary focus of this chapter and the next two chapters.
Section I: The Cardiac Cycle
The cardiac cycle is all events that occur during a single heartbeat. Systole is the scientific name for the heart’s contraction, and diastole refers to the heart’s relaxation.
The atria and ventricles are in diastole at the start of a cardiac cycle. During atrial diastole, the vena cava veins fill the right atrium with deoxygenated blood, and the pulmonary veins fill the left with oxygen-rich blood. Halfway through the atrial diastole, the tricuspid and bicuspid valves (A-V valves) open, and the atrial blood flows into the ventricles via gravity. Atrial systole begins when 70 percent of the atrial blood has entered the ventricles. The remaining atrial blood enters the ventricles via the atria systole.
Ventricular systole begins after atrial systole. Ventricular systole takes longer than atrial systole since it needs to pump most of its blood upward into the arteries. The A-V valves close, and the semilunar valves (aortic and pulmonary valves) open during ventricular systole. The closing of the A-V valves causes the loudest sound, called the “lub,” and it ensures blood does not flow back into the atria when the ventricles contract. The second, slightly quieter “dub” sound is produced by closing the semilunar valves during ventricular diastole. As the ventricles relax, the A-V valves open, allowing the ventricles to fill with atrial blood. The closure of the semilunar valves prevents the arterial blood from re-entering the ventricles. Therefore, the “lub” sound comes from ventricular systole, and the “dub” sound comes from ventricular diastole.


Section II: Cardiac Output
Cardiac output is the blood volume in liters (L) pumped by the heart per minute. Cardiac output (CO) is the sum of the number of cardiac cycles per minute (or heartbeats per minute) multiplied by the stroke volume. The stroke volume (SV) is blood volume in milliliters (ml) that the left ventricle pumps during a single ventricular systole. The left ventricle’s stroke volume gives a more accurate cardiac output measurement since it pumps blood throughout the body. However, stroke volume and heart rate (HR) are in constant flux; ergo, so is cardiac output. For example, a person’s heart maintains a resting CO of around 5 L/min. If their HR decreases, their SV will increase to maintain a 5 L/min CO. If their HR increases, their SV will decrease to maintain a 5 L/min CO.


Calculating Cardiac Output
Now, let’s calculate Bob Bobby’s CO. The formula for CO is:
CO= HR\:x\:SV
Bob Bobby has a resting HR of 68 beats/minute (bpm) and a SV of 72 ml. What is his CO in liters/minute?
\frac{68\:\bcancel{beats}}{minute}\:x\:\frac{72\:\bcancel{ml}}{\bcancel{beats}}\:x\:\frac{1\:L}{1000\:\bcancel{ml}} = 4.9\:L/minCalculating Stroke Volume
If you know a person’s end-diastolic and end-systolic volumes, you can calculate their SV. The end-diastolic volume (EDV) is blood collected when the left ventricle is in diastole. The end-systolic volume (ESV) is the blood remaining in the left ventricle at the end of ventricular systole. (Measuring the EDV and ESV is impossible in a high school classroom; therefore, EDV and ESV will be given values.)
EDV and ESV fluctuate with each cardiac cycle; however, the normal resting range for EDV is 95-235 ml, and the range for ESV is 25-95 ml. The normal resting range for SV is 60-75 ml. Let’s calculate Patient A’s and Patient B’s stroke volumes. Both patients are of the same age, sex, weight, and height.
SV=EDV\:-\:ESV


{\bf{Patient\:A:}}\:120\:ml\:-\:40ml=80\:ml{\bf{Patient\:B:}}\:120\:ml\:-\:80ml=40\:mlCalculating Heart Rate and Cardiac Output from EDV and ESV
Below is a table showing Patient A’s average resting cardiac cycle (one heartbeat).
| Time/Seconds | Volume/Milliters (ml) |
|---|---|
| 0.0 | 105 |
| 0.1 | 120 |
| 0.2 | 65 |
| 0.3 | 45 |
| 0.4 | 40 |
| 0.5 | 78 |
| 0.6 | 94 |
We can calculate Patient A’s heart rate using the time data in the first column. This is done by using the following formula:
\frac{Number\:of\:Second\:per\:Minute}{Length\:of\:Cardiac\:Cycle\:in\:Seconds}\:x\:\frac{1 beat}{1 minute}= Heart\:Rate\:(bpm)\frac{60\:\bcancel{seconds}}{0.6\:\bcancel{seconds}}\:x\:\frac{1 beat}{1 minute}= 100\:bpmBob Bobby’s EDV is the maximum blood volume in the left ventricle before systole, which is 120 ml. His ESV is the smallest blood volume in the left ventricle after systole, which is 40 ml. To find Bob Bobby’s stroke volume, we find the difference between his EDV and ESV, which we calculated as 80 ml (120 ml – 40 ml).
We can calculate his cardiac output by now that we have Bob Bobby’s heart rate (100 bpm)and stroke volume (80 ml).
\frac{100\:\bcancel{beats}}{minute}\:x\:\frac{80\:\bcancel{ml}}{\bcancel{beats}}\:x\:\frac{1\:L}{1000\:\bcancel{ml}} = 8.0\:L/minPatient B has a stroke volume of 40 ml, and he would need a heart rate of 200 bpm to pump the same volume of blood as Patient A. Thus, you can see that an increased HR compensates for a low stroke volume. A heart rate of 200 bpm is severe tachycardia, and if not treated, it will most likely result in a stroke or myocardial infarction (heart attack), if not both.
Calculating the Ejection Fraction
However, the EDV, ESV, and SV do not tell a physician the percentage of blood ejected from the left ventricle. The ejection fraction (EF) is the percentage of blood ejected from the left ventricle per heartbeat. The formula for EF is:
EF = (\frac{SV}{EDV})\:x\:100\%Let’s calculate Patient A’s and Patient B’s ejection fractions. The normal range for EF is between 50 to 70 percent.
{\bf{Patient\:A:}}\:\ (\frac{80\:\bcancel{ml}}{120\:\bcancel{ml}})\:x\:100\% = 66.7\%{\bf{Patient\:B:}}\:\ (\frac{40\:\bcancel{ml}}{120\:\bcancel{ml}})\:x\:100\% = 33.3\%According to the calculations, Patient A’s resting SV and EF are within the homeostatic range (67%), while Patient B’s measurements are not (33%). Patient B’s lower-than-average SV and EF will result in a decreased CO and a faster HR. A low CO is most likely due to a problem with the ventricles’ preload, contractility, and afterload.
Preload, Contractility, and Afterload
Imagine you are in a rubber band fight with your friends. You will need to extend the rubber band to hit your friends at a distance. The more you stretch a rubber band, the more potential energy builds up. The more potential energy there is, the more kinetic energy will be released when you let go of the rubber band, and the farther it will travel. Preload and contractility affect SV by the cardiac cells acting like rubber bands.
Cardiac fibers are stretchable; the more they stretch, the more potential energy they store. Preload is the degree of stretch in the ventricles’ cardiac fibers during ventricular diastole, which results in the EDV. The larger the preload, the higher the EDV. Cardiac fibers stretched to their limit will build up more potential energy and release more contractile force during ventricular systole. Contractility is the contractile force when the ventricles eject blood into the arteries. Ventricles with a larger preload and contractility will have a higher SV.
Afterload is the pressure the heart has to work against to eject the blood during ventricular systole. A lower afterload will increase SV, and a higher afterload will decrease SV. For example, a healthy aorta will have a larger diameter than a diseased aorta. Over years of eating junk food and living a sedentary lifestyle, cholesterol and blood clots build up in the aorta, decreasing its diameter. The smaller aortic diameter will increase the afterload. The increased afterload will decrease the myocardium’s preload and contractility, resulting in a lower SV and CO.


Calculating Cardiac Output By Using Body Surface Area
Let’s say you do not know the EDV or ESV of a patient. Does this mean you cannot calculate their SV?
Urrr, no?
Yep. You can use a patient’s surface area in square meters and their HR to estimate the patient’s CO and SV.
A nomogram (pictured below) finds the body surface area (SA). Locate the patient’s weight and height and connect the two with a ruler. The vertical line in the center is a scale of SA in square meters (m2). The point at which the ruler crosses the centerline indicates the patient’s SA. You will need to find the patient’s cardiac index, which is the amount of blood pumped per minute to every square meter of SA. The average cardiac index in a resting adult is 3.4 L/m2/min. Let’s calculate the patient’s CO and SV.
Let’s compute your patient’s CO and SV. Your patient weighs 196 pounds and is 5’10” tall with a resting HR of 74 bpm. What is the patient’s CO in liters and SV in ml?

- Patient’s SA: 2.08 m2
Formula to find CO:
Body\:SA\:x\:3.4\:L/m^2/min= CO
Now let’s find the patient’s CO using their body surface area (2.08 m2):
2.08\:m^2\:x\:3.4\:L/m^2/min= 7.1\:L/min
Now that we know their resting CO is 7.1 L/min, we can rearrange the CO formula (CO = HR x SV) to calculate their stroke volume. (The patient’s resting HR is 74 bpm.)
\frac{CO}{HR}=SV\frac{7.1\:L/\bcancel{min}}{74\:beats/\bcancel{min}}=0.096\:L/beatNow we need to convert the SV into milliliters.
\frac{0.096\:\bcancel{L}}{beat}\:x\:\frac{1000\:ml}{1\:\bcancel{ L}}= 96\:ml/beatTherefore, the patient has a resting CO of 7.1 L/min and a SV of 96 ml/beat.
Section III: Using an ECG Trace to Find Cardiac Output
The figure below is an electrocardiogram (ECG) trace from a healthy heart. A single heartbeat on an ECG is called the PQRST complex, with each letter representing a wave.

An ECG trace contains a great deal of critical information about heart function. An ECG can tell you the functionality of:
- The four chambers of the heart
- The heart’s pacemaker and other electrical circuits
- The rhythm of the heart and heart rate
- The flow of blood through the heart
- Atrial contraction and relaxation
- Ventricular contraction and relaxation
- Cardiac action potentials
- Cardiac output (the volume of blood the heart pumps per minute)
An ECG or EKG is one of the best, if not the best, tools to analyze the heart’s physiology. Analyzing an ECG has a bit of a learning curve, but once you understand the basics, analysis becomes easier.
Let’s start with what all the squares on the ECG trace paper represent. The y-axis denotes voltage in millivolts (mV), and the x-axis represents time in seconds. The smallest squares are one millimeter long and denote a voltage of 0.10 mV and a time of 0.04 seconds. The large squares include five smaller squares and represent a voltage of 0.50 mV and a time of 0.20 seconds. (See the figure below.)

Below is an ECG trace from a healthy adult at rest. A normal trace is called a sinus rhythm. Calculate the person’s resting HR, CO, and SV from an ECG trace. (The ECG trace below has been enlarged for learning purposes. The small squares are bigger than a square millimeter, and the large squares are bigger than five square millimeters.)
Step 1: Finding the Resting Heart rate (HR)
\frac{1500}{the\:number\:of\:small\:squares\:between\:R\:waves}=HR\frac{1500}{21}=71\: bpm
Step 2: Calculating Cardiac Output (CO)
- The person whose trace this came from weighs 185 lbs. and is 6’1” tall. Plug this information into the nomogram to find his surface area per m2, which is 2.10 m2.
- Now find the person’s CO in liters using this formula: Body SA x 3.4 L/m2/min = CO

2.10\:m^2\:x\:3.4\:L/m^2/min= 7.1\:L/min
Step 3: Calculating Stroke Volume (SV)
- Let’s find the person’s Plug the answer to 2a in step 2 into this formula: CO / HR = SV; and then convert L to ml: SV in liters x 1000ml/L = SV in mL
\frac{7.1\:L/\bcancel{min}}{71\:beats/\bcancel{min}}=0.01\:L/beat\frac{0.01\:\bcancel{L}}{beat}\:x\:\frac{1000\:ml}{1\:\bcancel{ L}}= 100\:ml/beatBy using both the ECG trace and the nomogram, we have calculated the patient’s HR (71 bpm), CO (7.1 L/min), and SV (100 ml/beat).